
Dr. Ankur Verma
Co-founder & CEO, Lightscline
Co-author of the Geo-Sense paper and founder of Lightscline. Leads TB-scale sensor-data analysis and scientific workflow development across ocean, energy, and industrial deployments.
in LinkedIn Lightscline
Lightscline · OCEANS 2026 Monterey · Half-day tutorial
Accelerating TB-Scale Multi-Modal Ocean Sensing Workflows: A Hands-On Tutorial on the Geo-Sense DAS Deployment
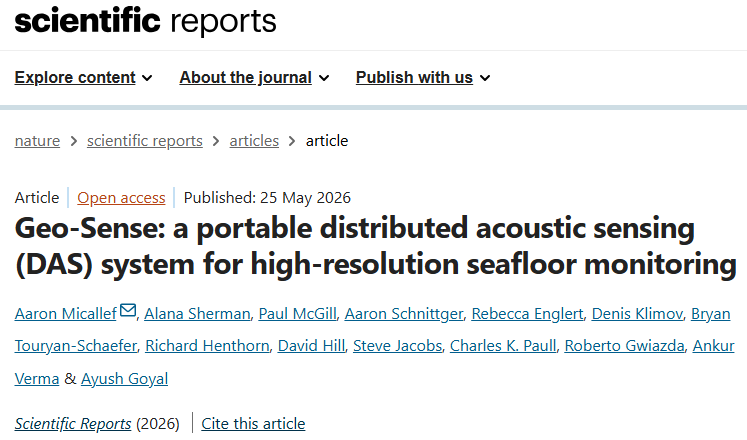
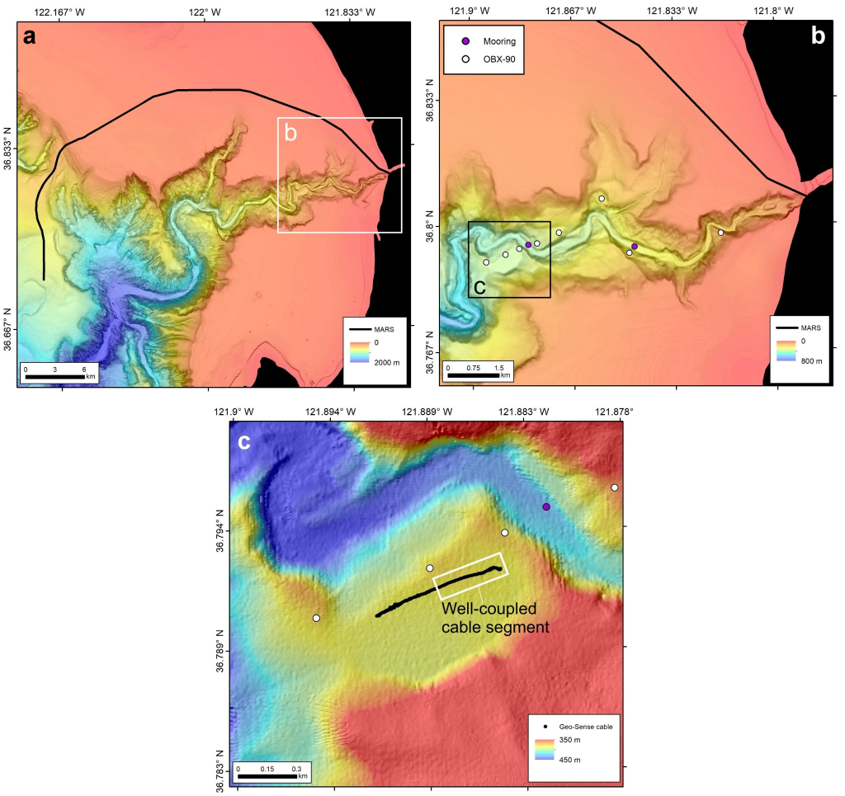
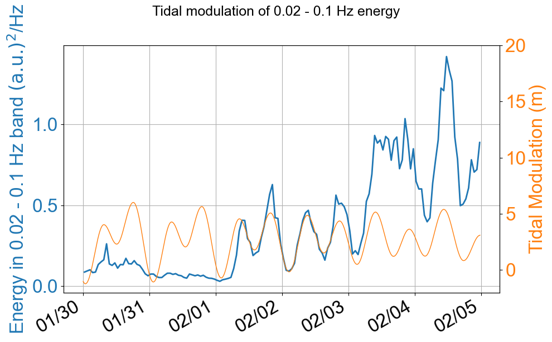
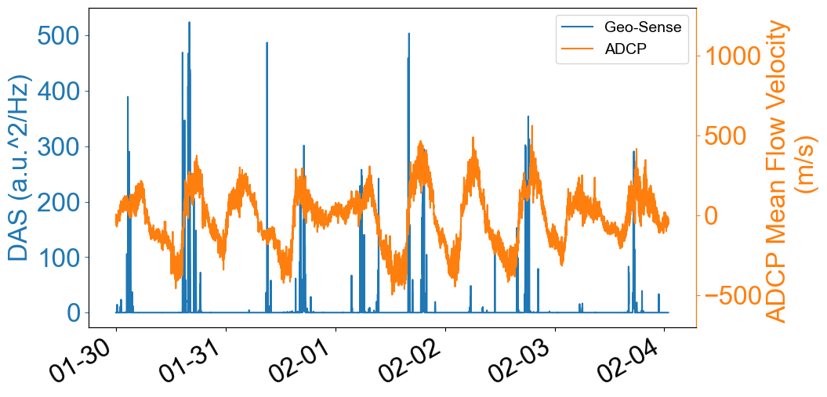
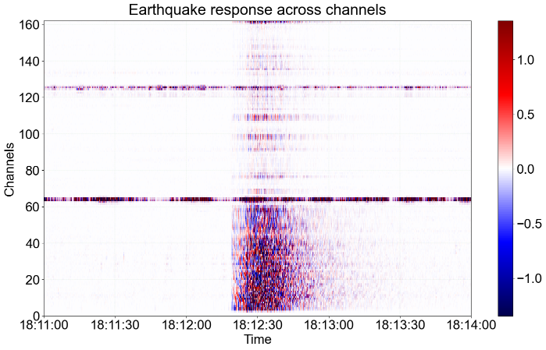
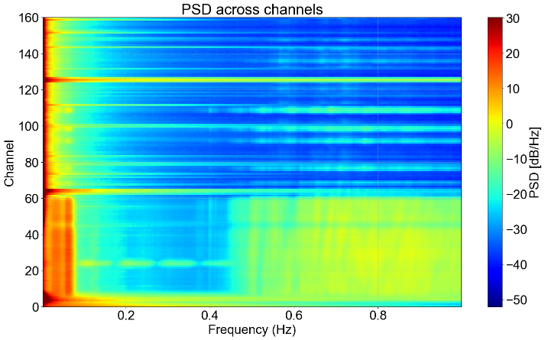
Geo-Sense: a portable Distributed Acoustic Sensing (DAS) system for high-resolution seafloor monitoring.
Read the paperWhy attend?
Ocean sensing workflows
Multi-modal ocean sensing has entered a new regime of data scale: deep-water Distributed Acoustic Sensing (DAS) deployments alone can produce terabytes of data per day, and comprehensive scientific interpretation typically requires combining DAS with ADCP, weather, current, and seismic catalog data. In the Geo-Sense study and in comparable deployments Lightscline has worked with, we see a common thread of workflow problems consuming substantial SME time and effort:
Finding specific signatures—Scholte or infragravity waves on a 50–100 km DAS cable, cable strumming, coupling anomalies, whale or other bio-acoustic signatures (~100 Hz)—across terabytes of DAS is fundamentally a search problem with no known query.
Each scientific question demands several plot types (PSD, spectrogram, f–k, time–channel, multi-day spectrogram) at different pre-processing, filtering, and spatio-temporal resolutions. Building these one-off slows experimentation and interpretation.
Once a signature is identified in DAS, supporting evidence lives in ADCP, OBS, USGS catalog, NOAA tidal, and mooring records—each in its own format, time base, and coordinate system, requiring repeated spatio-temporal alignment.
SMEs must move between IDEs, notebooks, scripts, and ad-hoc dashboards, fragmenting attention.
Locating the right files for a specific event in a deep, deployment-specific directory tree takes meaningful time on every iteration.
This tutorial uses the public Geo-Sense DAS deployment in Monterey Bay (Micallef et al., 2026), published in Scientific Reports, as a teaching anchor. Participants will reproduce the paper’s central figures from raw data hosted on a pre-staged cloud bucket using the Lightscline dashboard for TB-scale multi-modal data, then extend the analysis into the infragravity-wave band.
Lightscline Data-discovery Dashboard
Interactive preview · click inside to explore the interface
Tutorial participants will receive a unique username and password for the full dashboard environment.
Lightscline Data-discovery DashboardOrganizers & instructors
Co-founder & CEO, Lightscline
Co-author of the Geo-Sense paper and founder of Lightscline. Leads TB-scale sensor-data analysis and scientific workflow development across ocean, energy, and industrial deployments.
in LinkedIn
Co-founder & CTO, Lightscline
Leads Lightscline’s software platform for TB-scale multi-modal sensor data, including the dashboard infrastructure used in this tutorial. Co-author of the published Geo-Sense study.
in LinkedIn
Senior Scientist, MBARI · Tutorial sponsor
Lead author of the Geo-Sense paper. Frames the deployment, original scientific analysis, and open questions explored by participants during the tutorial.
MB MBARIWho should attend
Physical oceanographers, marine geoscientists, ocean and offshore engineers, and data scientists who routinely work with high-volume multi-modal sensor data.
Capacity is capped at 50 participants to support meaningful instructor attention during hands-on segments.
OCEANS 2026
Open the Lightscline data-discovery interface. Tutorial participants will receive unique credentials for the full hands-on environment.
Lightscline Data-discovery Dashboard